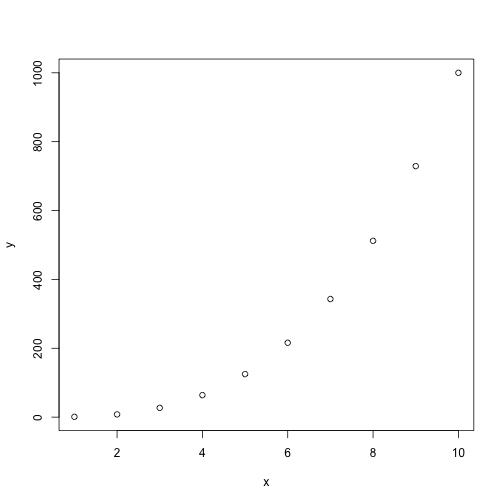
class: center, middle, inverse, title-slide # intRo: Data visualisation with R ## 03 — Plot with ggplot2 ### Stefano Coretta --- # Visualise data  --- # Graphic systems - Base R. - lattice. - ggplot2. - more... --- # Base R plotting function ```r x <- 1:10 y <- x^3 plot(x, y) ``` --- # Base R plotting function <!-- --> --- # Base R plotting function ```r x <- seq(1, 10, by = 0.01) y <- x^3 plot(x, y, type = "l", col = "purple", lwd = 3, lty = "dashed") ``` --- # Base R plotting function <!-- --> --- # Packages to the rescue <br> - The R **library** contains the installed packages. - Base R. - Extra packages. - Install extra packages with `install.packages()`. -- .bg-washed-blue.b--dark-blue.ba.bw2.br3.shadow-5.ph4.mt5[ Run this in the console: ```r install.packages("fortunes") ``` ] --- # Packages to the rescue To use a package installed in the library, you `attach` the package with `library()`. -- .bg-washed-blue.b--dark-blue.ba.bw2.br3.shadow-5.ph4.mt5[ Run this in the console: ```r library(fortunes) ``` ] --- # Packages to the rescue Now you can use the functions provided by the attached package -- .bg-washed-blue.b--dark-blue.ba.bw2.br3.shadow-5.ph4.mt5[ Run this in the console: ```r fortune() ``` ``` ## ## John Fox: I've never understood why it's legal to change the built-in global ## "constants" in R, including T and F. That just seems to me to set a trap for users. ## Why not treat these as reserved symbols, like TRUE, Inf, etc.? ## Rolf Turner: I rather enjoy being able to set pi <- 3. ## -- John Fox and Rolf Turner ## R-help (June 2013) ``` ] --- # Do you sleep like a giraffe or a brown bat? ```r ggplot( data = msleep, mapping = aes(x = sleep_total, y = sleep_rem) ) + geom_point() ``` --- # Do you sleep like a giraffe or a brown bat? <img src="index_files/figure-html/msleep-plot-1.png" height="500px" style="display: block; margin: auto;" /> --- # Do you sleep like a giraffe or a brown bat? ```r library(ggrepel) ggplot( data = msleep, mapping = aes(x = sleep_total, y = sleep_rem, label = name) ) + geom_point() + geom_label_repel() ``` --- # Do you sleep like a giraffe or a brown bat? <img src="index_files/figure-html/msleep-lab-plot-1.png" height="500px" style="display: block; margin: auto;" /> --- # Social media users 2008-2019 ```r social %>% filter(platform %in% c( "Facebook", "Twitter", "TikTok", "Instagram", "YouTube" ) ) %>% ggplot(aes(year, users, colour = platform)) + geom_line() + geom_point() ``` --- # Social media users 2008-2019 <img src="index_files/figure-html/social-plot-1.png" height="500px" style="display: block; margin: auto;" /> --- # Language endangerment ```r endangered %>% ggplot(aes(status, fill = status)) + geom_bar() + scale_fill_brewer(palette = "Reds") ``` --- # Language endangerment <img src="index_files/figure-html/endanger-plot-1.png" height="500px" style="display: block; margin: auto;" /> --- # Hogwarts houses and astrological elements ```r harry_potter %>% ggplot(aes(element, fill = house)) + geom_bar(position = "dodge") + scale_fill_manual( values = c("#76040a", "#f29e02", "#0121a2", "#1d492c") ) ``` --- # Hogwarts houses and astrological elements <img src="index_files/figure-html/hp-plot-1.png" height="500px" style="display: block; margin: auto;" /> --- # Student/teacher ratio ```r df_ratios %>% mutate( region = fct_reorder(region, -student_ratio_region) ) %>% ggplot( aes(x = region, y = student_ratio, color = region) ) + geom_jitter(size = 4, alpha = 0.6, width = 0.2) + coord_flip() + labs( y = "Student to teacher ratio", x = element_blank() ) + theme(legend.position = "none") ``` --- # Student/teacher ratio <img src="index_files/figure-html/st-ratio-plot-1.png" height="500px" style="display: block; margin: auto;" /> --- # Do you decline invitations? ```r ggplot(data = fly) + geom_mosaic(aes(x = product(rude_to_recline), fill = do_you_recline)) + labs(x = "Is it rude to decline?", y = "Do you decline?") + theme_mosaic() + theme(legend.position = "none") ``` --- # Do you decline invitations? <img src="index_files/figure-html/decline-plot-1.png" height="500px" style="display: block; margin: auto;" /> --- class: middle center inverse .f1[TUTORIAL]