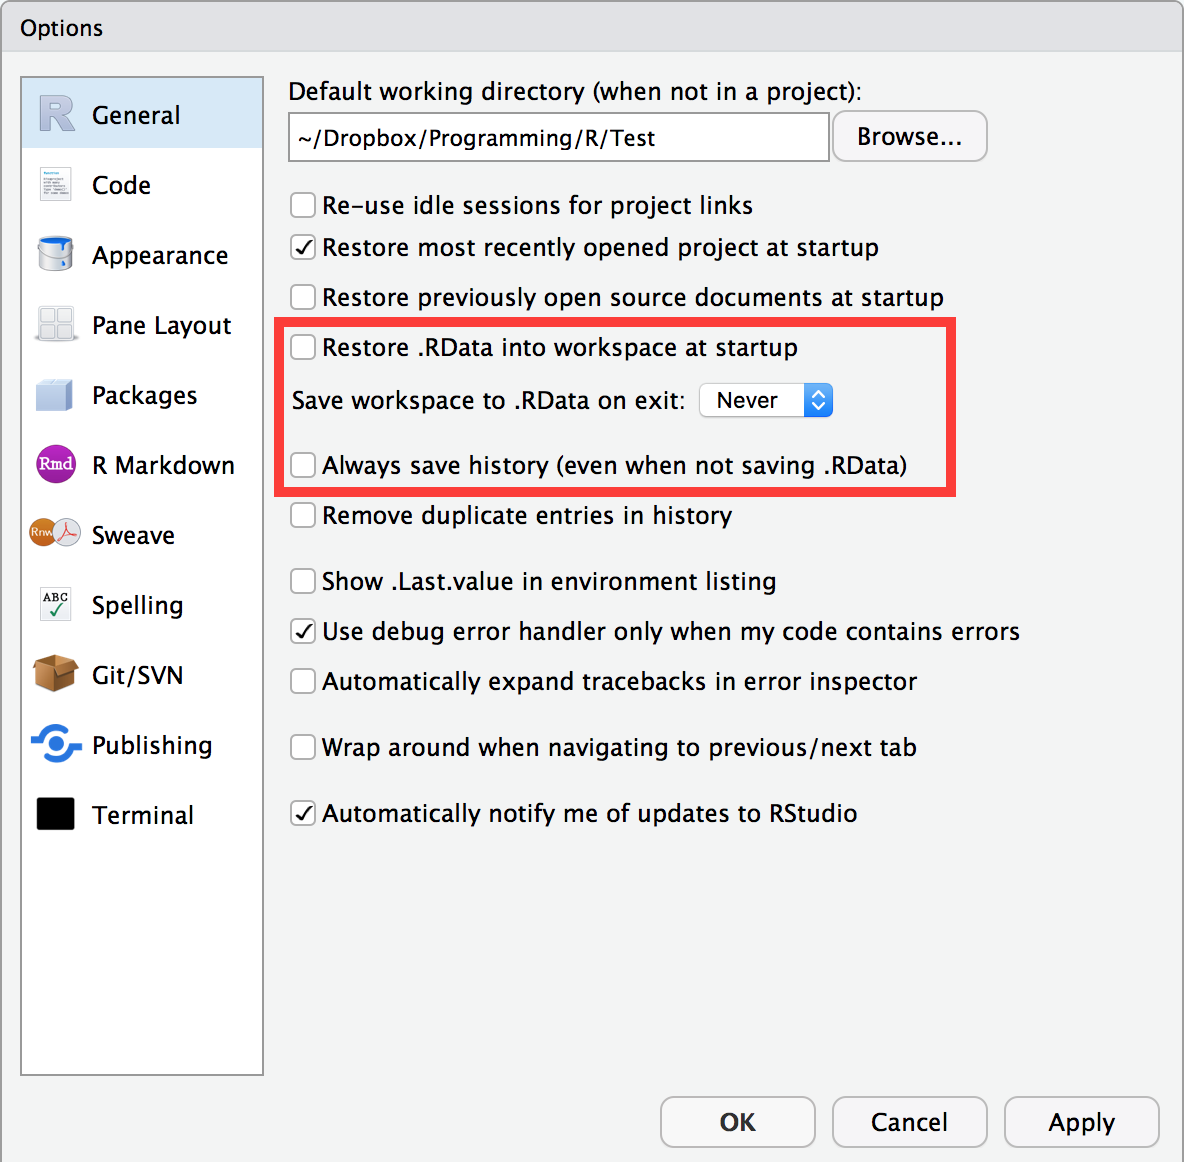
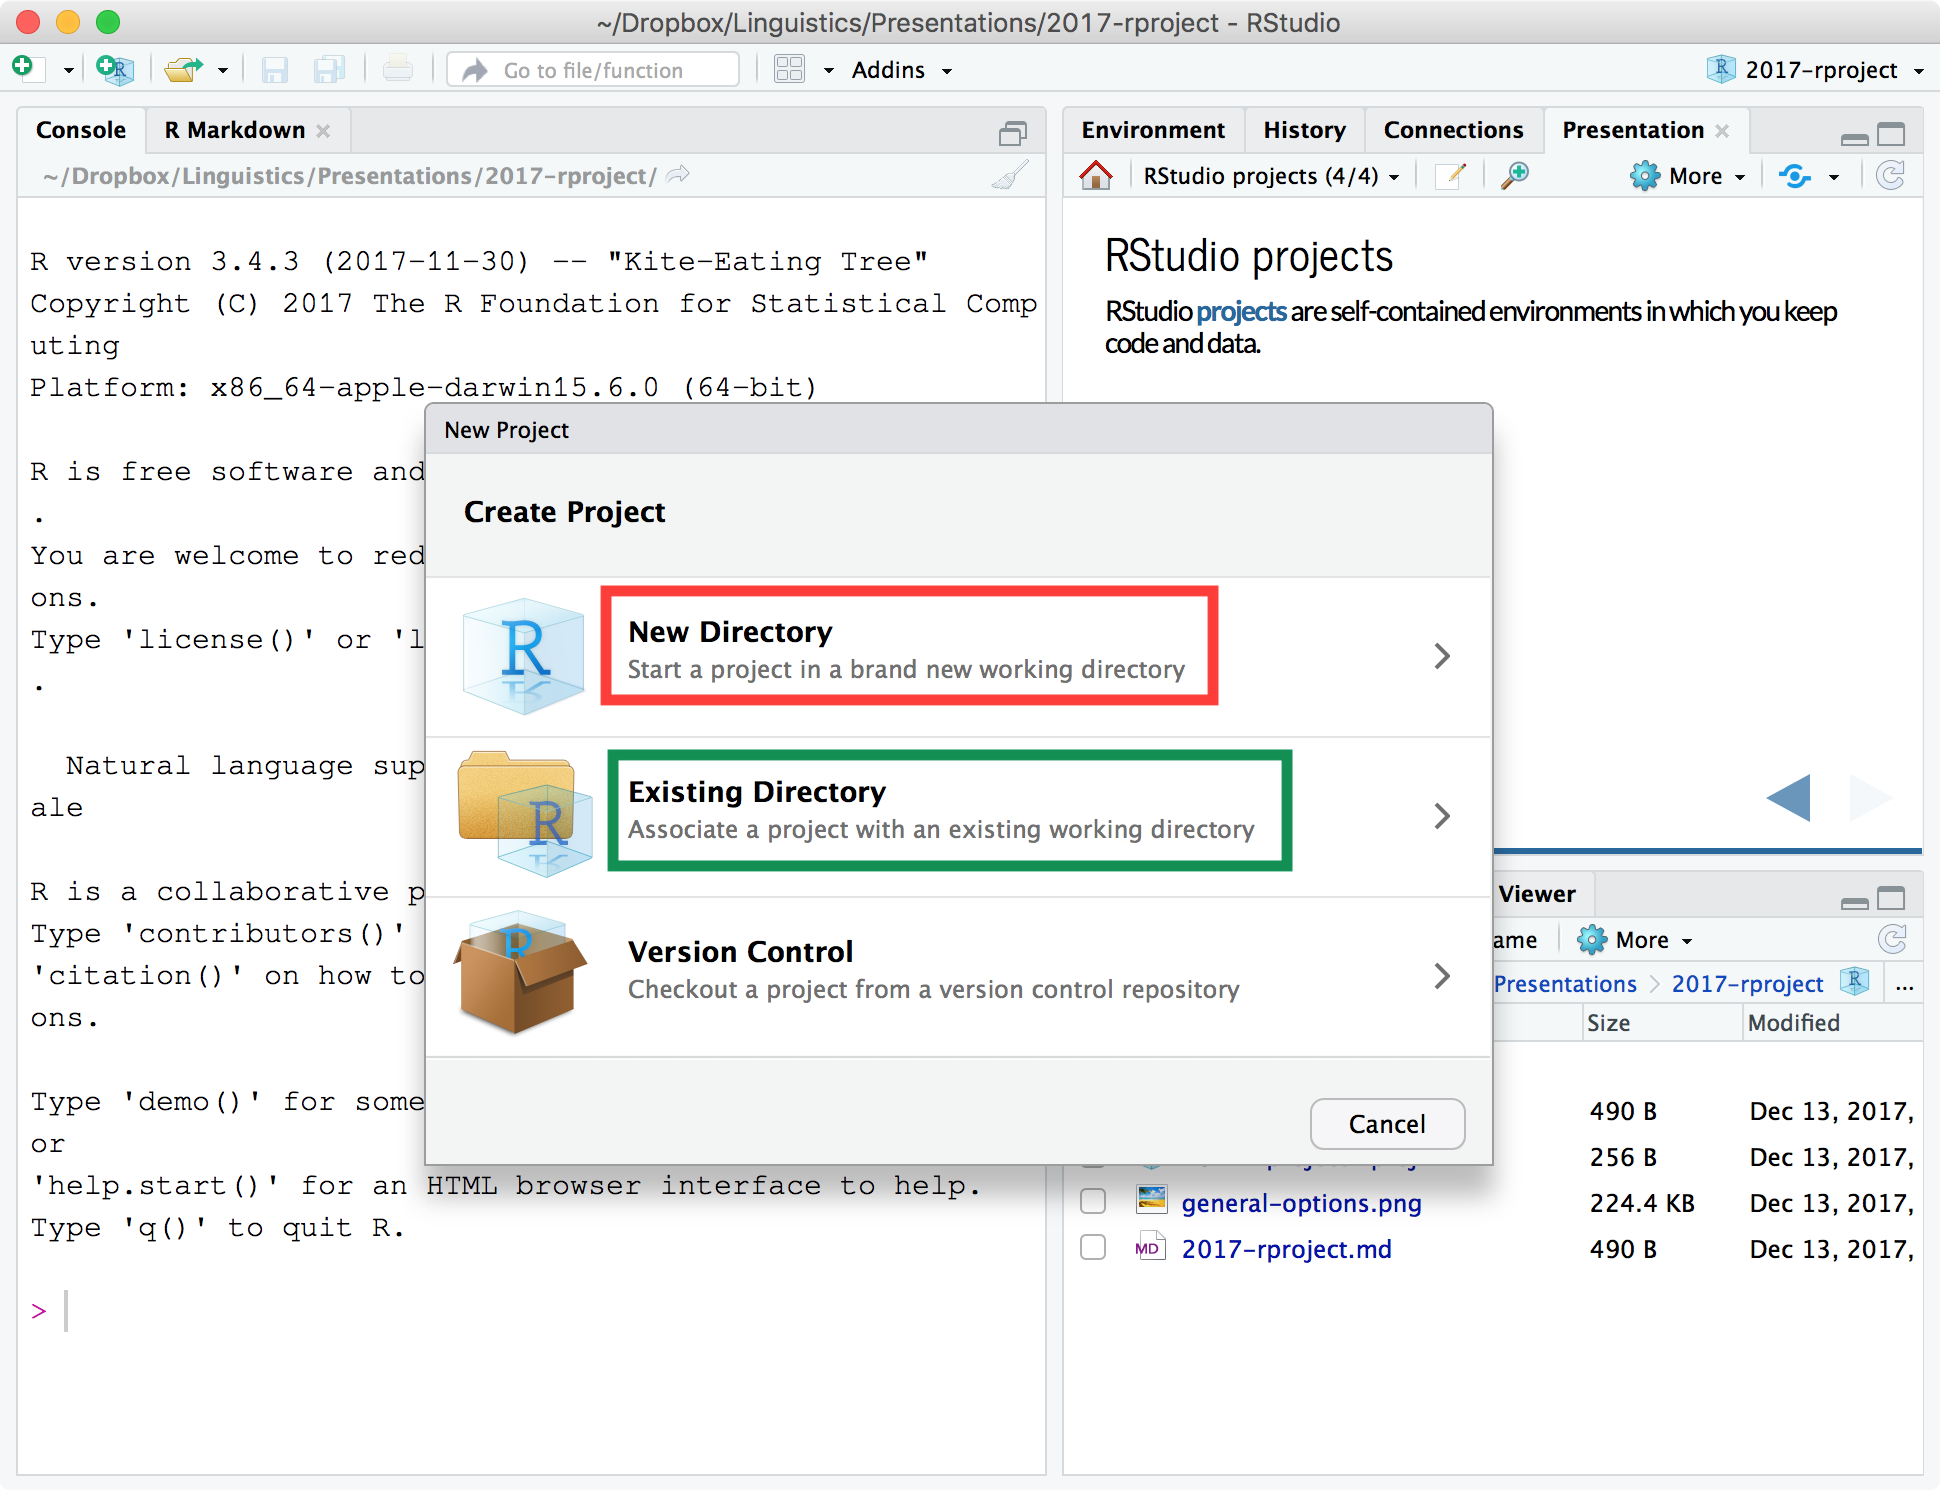
class: center, middle, inverse, title-slide # intRo: Data visualisation with R ## 05 — Research Data Management ### Stefano Coretta --- # RStudio .center[] --- # RStudio options .center[] --- # RStudio projects RStudio **projects** are self-contained environments in which you keep code and data. .center[] --- class: smaller-font # RStudio projects .pull-left[ .f2[Advantages] - You can open and work on **multiple projects** at a time. - The files of each individual projects are easily accessible by using **relative paths**, so goodby to `setwd()` (for example `./data/results.csv` if your project has a file `results.csv` in the `data/` folder). - You can **isolate** package **dependencies** with `renv`. - It simplifies the **distribution** of your research (for example, as an R package). ] -- .pull-right[ .f2[Disadvantages] - **None**! ] --- # Save code in scripts <br> - <u>R scripts</u> are files with the extension `.R`. -- - Be sure to write <u>standalone</u> code (= code that runs from start to finish without errors). -- - <u>Comment</u> your code, for your future self and for others. -- - Even better... use <u>Rmarkdown</u> files! --- # R Markdown **Dynamic report** writing in R with R Markdown. * <http://rmarkdown.rstudio.com> -- * Text and code in a single document (`.Rmd`). -- * Several output formats (`.html`, `.pdf`, `.docx`, ...). -- * R Markdown templates for journal submissions: <https://github.com/rstudio/rticles>. -- * You can also write books, presentations, websites and blogs. --- # Organising folders and files From the [Open Science Framework](http://help.osf.io/m/bestpractices/l/611391-organizing-files). * Separate <u>data</u> from <u>code/text</u>. * Separate <u>raw data</u> from <u>derived data</u>. * Treat raw data as <u>read-only</u>. * Use a <u>versioning system</u> (like `git` with GitHub). --- # Summary * Use **RStudio**. * **Don't save `.Rdata`** and do not load it at start up. * Separate **code** from **data** (*raw* and *derived*). * Write **dynamic reports** with R Markdown (and avoid copy-paste). --- background-image: url(../img/nick-fewings-2qXNT7LMfpY-unsplash.jpg) background-size: cover ??? Photo by <a href="https://unsplash.com/@jannerboy62?utm_source=unsplash&utm_medium=referral&utm_content=creditCopyText">Nick Fewings</a> on <a href="https://unsplash.com/s/photos/mouse?utm_source=unsplash&utm_medium=referral&utm_content=creditCopyText">Unsplash</a> --- # Extra: Research compendia with R packages * <https://github.com/ropensci/rrrpkg> * <https://www.r-bloggers.com/how-to-develop-good-r-packages-for-open-science/> * <http://r-pkgs.had.co.nz>